What & Who You Know: How to get a job in cybersecurity with no experience
June 10, 2022
Welcome, Awingu!
June 13, 2022A compelling story

This article is part of a series in which we will explore several features, principles, and the building blocks of a security detection engine within an extended detection and response (XDR) solution.
In this second installment, we will look at ways of structuring the presentation of machine-generated alerts, so that each alert offers a cohesive and compelling narrative, as if written by a human analyst, at scale and in realtime.
The challenge
In cyber security, we are used to two types of stories.
The first story is common for reports written by humans. It contains sections such as “impact,” “reproduction,” and “remediation” to help us understand what is at stake and what we need to fix. For example:
IMPACT: An SSH server which supports password authentication is susceptible to brute-forcing attacks.
REPRODUCTION: Use the `ssh` command in verbose mode (`ssh -v`) to determine supported authentication methods. Look for “keyboard-interactive” and “password” methods.
REMEDIATION: Disable unneeded authentication methods.
The second story comes from machine detections. It is much terser in content and sometimes leaves us scratching our heads. “Malware,” the machine says with little explanation, followed by a horde of gibberish-looking data of network flows, executable traces, and so on.

The challenge is now to get the best of both worlds: to enhance machine-generated alerts with the richness of human-written reports. The following sections explain how this can be approached.
How was it detected?
In our example of a report written by a human, the “reproduction” section would help us understand, from a factual perspective, how exactly the conclusions were derived.
On the other hand, the machine-generated horde of data provides evidence in a very nondescript way. We would need to be smart enough to spot or reverse-engineer what algorithm the machine was following on said data. Most security analysts do not wish to do this. Instead, they attempt to seek the first story type. “Surely, someone must have written a blog or something more descriptive about this already,” they would say. Then, they would copy-paste anything that looks like a searchable term – an IP address, domain, SHA checksum – and start searching it, either on a threat intelligence search site or even a general-purpose search engine.
Having such cryptic machine-generated alerts is leading us to our first two issues: first, when the story is incomplete or misunderstood, it may lead the analyst astray. For example, the security event might involve requests to communicate with an IP address, and the analyst would say, “This IP address belongs to my DNS server, so the traffic is legitimate.” However, the detection engine was really saying, “I suspect there is DNS tunnelling activity happening through your DNS server—just look at the volume.”
Second, when an analyst seeks explanations from elsewhere, the main function of an advanced detection engine — finding novel, localized, and targeted attacks — cannot work. Information on attacks is generally available only after they have been discovered and analyzed, not when they happen initially.
A common approach to remedy this situation is to include a short description of the algorithm. “This detector works by maintaining a baseline of when during the day a user is active and then reports any deviations,” a help dialog would say. “Okay, that’s clever,” an analyst would reply. But this is not enough. “Wait, what is the baseline, and how was it violated in this particular security event?” To find the answer, we need to go back to the horde of data.
Annotated security events
To mimic the “reproduction” section of the human-written report, our security events are enriched with an annotation—a short summary of the behavior described by the event. Here are a few examples of such annotated events:
In the first and second cases, the story is relatively straightforward: in the horde of data, successful communication with said hostnames was observed. An inference through threat intelligence associates these hostnames to the Sality malware.
The third line informs us that, on a factual basis, only a communication with an IP address was observed. Further chain of inferences is that this IP address was associated by a passive DNS mechanism to a hostname which is in turn associated to the Sality malware.
In the fourth event, we have an observation of full HTTP URL requests, and inference through a pattern matcher associates this URL to the Sality malware. In this case, neither the hostname nor the IP address is important to the detector.
In all these annotated events, an analyst can easily grasp the factual circumstances and what the detection engine infers and thinks about the observations. Note that whether these events describe benign, malicious, relevant, or irrelevant behavior, or whether they lead to true or false positives, is not necessarily the concern. The concern is to be specific about the circumstances of the observed behavior and to be transparent about the inferences.
What was detected?
When we eventually succeed in explaining the security events, we might not be finished with the storytelling yet. The analyst would face another dilemma. They would ask: “What relevance does this event have in my environment? Is it part of an attack, an attack technique perhaps? What should I look for next?”
In the human-written report, the “impact” section provides a translation between the fact-based technical language of “how” and the business language of “what.” In this business language, we talk about threats, risks, attacker objectives, their progress, and so on.
This translation is an important part of the story. In our previous example about DNS tunnelling, we might want to express that “an anomaly in DNS traffic is a sign of an attacker communicating with their command-and-control infrastructure,” or that “it is a sign of exfiltration,” or perhaps both. The connotation is that both techniques are post-infection, and that there is probably already a foothold that the attacker has established. Perhaps other security events point to this, or perhaps it needs to be sought after by the analyst.
When it is not explicit, the analyst needs to mentally perform the translation. Again, an analyst might look up some intelligence in external sources and incorrectly interpret the detection engine’s message. Instead, they might conclude that “an anomaly in DNS traffic is a policy violation, user error, or reconnaissance activity,” leading them astray from pivoting and searching for the endpoint foothold that performs the command-and-control activity.
What versus How
We take special attention not to mix these two different dictionaries. Rather, we express separately the factual observations versus the conclusions in the form of threats and risks. Inbetween, there are the various chains of inferences. Based on the complexity, the depth of the story varies, but the beginning and the end will always be there: facts versus conclusions.
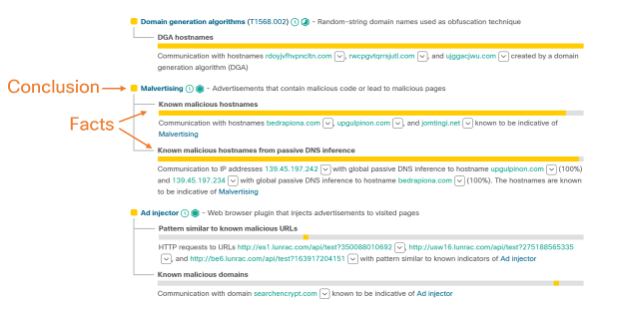
This is very similar to how an analyst would set up their investigation board to organize what they know about the case. Here is an elaborate example:
In this case, from top to bottom:
- Use of a domain generation algorithms (DGA) technique was inferred by observing communication to hostnames with random names.
- Malicious advertising (malvertising) was inferred by observing communication with hostnames and by observing communication with IP addresses that have passive DNS associations with (the same) hostnames.
- Presence of an ad injector was inferred by observing communication to specific URLs and inferred by a pattern matcher, as well as communication to specific hostnames.
In all points, the “what” and “how” languages are distinguished from each other. Finally, the whole story is stitched together into one alert by using the alert fusion algorithm described in the Intelligent alert management blog post.
Wrap-up
Have we bridged the storytelling gap between machine-generated and human-generated reports?
Threat detections need to be narrated in sufficient detail, so that our users can understand them. Previously, we relied on the human aspect—we would need to document, provide support, and even reverse-engineer what the detection algorithms said.
The two solutions, distinguishing the “what/how” languages and the annotated events, provide the bandwidth to transmit the details and the expert knowledge directly from the detection algorithms. Our stories are now rich with detail and are built automatically in real time.
The result allows for quick orientation in complex detections and lowers the time to triage. It also helps to correctly convey the message, from our team, through the detection engine, and towards the analyst, lowering the possibility of misinterpretation.
This capability is part of Cisco Global Threat Alerts, currently available within Cisco Secure Network Analytics and Cisco Secure Endpoint, and has been continually improved based on customer feedback. In the future, it will also be available in Cisco SecureX XDR.
Follow the series on Security detection with XDR
We’d love to hear what you think. Ask a Question, Comment Below, and Stay Connected with Cisco Secure on social!
Cisco Secure Social Channels


